A peptide can test at 99% purity and still contain far less than 99% peptide by weight.
A conventional high-performance liquid chromatography (HPLC) purity result compares the target peptide’s detector signal with other detected peaks. It does not tell you how much of the vial’s powder is peptide. Nor does it tell you how many milligrams of peptide the vial contains.
These measurements answer different questions. So if a certificate reports only purity, it has not established peptide content or the amount per vial.
Peptide Purity vs. Peptide Content: What’s the Difference?
The three measurements most often confused are HPLC purity, net peptide content, and quantity per vial.
1. HPLC purity
The percentage of the integrated chromatographic signal attributed to the target peak, under one specified analytical method.
2. Net peptide content
The share of the material’s mass that is peptide, on a stated method and reporting basis. In other words, it is a mass fraction, and a report expresses it per unit of material. In a paper on reference standards for synthetic peptide therapeutics, United States Pharmacopeia scientists work through a theoretical example in which the material comes out at 0.93 mg of peptide, as the free base, per mg of material on an anhydrous basis.
This is a theoretical calculation rather than a specification for commercial products. “Anhydrous basis” means the water content has been excluded. The same material will therefore have a different peptide-content figure when measured as-is.
3. Quantity per vial
The measured amount of the target peptide in that vial, usually in milligrams. Unlike net peptide content, it is an absolute amount. The pharmacopeia assigns it by running an assay on the vialed material against a characterized bulk standard, then correcting the result for the purity of that bulk.
In practice, though, laboratories do not all use these terms the same way. The method and the reporting basis matter more than the label on the number.
| Measurement | What it measures | What it does not establish |
|---|---|---|
| HPLC purity | Relative integrated detector response for the target peak | The actual peptide mass per vial |
| Net peptide content | Peptide mass relative to the mass of the material | That the vial holds its labeled quantity |
| Quantity per vial | The measured amount of the target peptide | The overall chromatographic purity |
What Does 99% HPLC Purity Actually Mean?
High-performance liquid chromatography pushes a dissolved sample through a packed column. Components travel at different speeds, so they come off the column at different times.
A detector records what leaves the column. The output is a chromatogram: a baseline with peaks on it, each peak a component that separated out.
The software then integrates the area under each peak. Finally, the target peptide’s area is divided by the total integrated area, and the result is reported as a percentage.
That percentage is a ratio of detector response. It is not a ratio of mass.
Why the two can diverge
Detector response depends on the compound and the method. An ultraviolet detector, for instance, sees what absorbs at the chosen wavelength. A mass spectrometer sees what ionizes.
So anything that responds weakly, or not at all, is under-represented in the reported signal. It can still be sitting in the vial, adding weight.
Metrology researchers at the National Research Council Canada make the point directly in a Metrologia study on quantifying trifluoroacetic acid in peptide reference materials. Purity measured by liquid chromatography with ultraviolet detection, they write, can greatly underestimate or miss counter-ion salts, which overestimates purity.
A 99% chromatographic area-purity result means the target accounted for 99% of the integrated detector response under that method. But it does not mean 99% of the powder’s mass is peptide.
What HPLC can do
With an appropriate method and a characterized reference standard, HPLC can also measure peptide quantity. In fact, the USP paper describes assigning milligrams per vial with a compendial HPLC assay.
An HPLC area-purity figure and a calibrated quantitative assay answer different questions. Both use chromatography, but only the calibrated assay measures quantity.
What Makes Up the Rest of the Powder?
Lyophilized peptide powders can contain counterions and residual moisture, along with impurities from manufacturing. Those categories have different meanings, so they must be evaluated separately.
Expected constituents
Counterions. A peptide carries charge, and in a solid salt form that charge is balanced by a counterion. Trifluoroacetate and acetate are the common ones. A laboratory measures them on a weight-for-weight basis, separately from chromatographic impurities.
Residual moisture. Freeze-dried material holds water, and peptides also take up more from the air. Karl Fischer titration measures it, and a report can then state content on an anhydrous or an as-is basis.
Process-related impurities
These arise from how the manufacturer made the material. Whether a given level is acceptable depends on the compound, the intended use, the specification it is held to, and the method used to measure it.
Residual solvents. Traces left from synthesis and purification.
Inorganic residues. Non-peptide matter from processing.
Peptide-related impurities. Incomplete sequences, deletions, and chemically modified forms of the target peptide.
Finding a process-related impurity does not automatically mean a batch fails its specifications. Instead, what matters is which substances were measured, at what levels, and against what limits. The pharmacopeia paper puts the principle plainly: for mass balance purity assignment, a laboratory should identify and measure every species other than the native peptide.
How counterions affect powder weight
Chemists use trifluoroacetic acid to cleave synthetic peptides from the solid support, and it co-crystallizes with the peptide. The Metrologia authors describe circumstances in which it accounts for up to roughly 25% of a preparation’s weight. That is a reported example of a high proportion, not a typical figure or a universal maximum.
Their own measurement was of one material: a candidate angiotensin II reference material, which carried a trifluoroacetate mass fraction of 246.8 mg per gram. That result describes that material, but it does not generalize to research peptides as a class.
The paper discusses counterions under the heading of impurities because mass balance accounts for everything that is not the native peptide. Still, that accounting convention does not make a counterion an accidental contaminant. In a peptide salt, counterions balance electrical charge.
Water and counterion figures explain part of the gap between purity and content. They do not, however, establish that the vial holds its labeled milligrams. Quantity has to be measured on its own appropriate basis.
How Laboratories Measure Net Peptide Content
Laboratories may combine several methods to characterize peptide content. Each answers a different analytical question. Some quantify the peptide itself. Others measure the components around it, so the peptide figure can be put on a stated basis.
Methods that quantify the peptide
Amino acid analysis. The method hydrolyzes the peptide into its amino acids, then quantifies them against standards. It is a well established route to peptide content, though the result depends on the hydrolysis, the reference materials, and the sample itself, and other amino-acid-containing material in the sample can interfere.
Quantitative HPLC assay. The laboratory runs the sample against a characterized reference standard of known content. With suitable calibration this measures peptide quantity, and it is how the pharmacopeia paper assigns milligrams per vial.
Methods that measure the surrounding components
Karl Fischer titration. Measures water content.
Counterion analysis. Measures specified counterions by mass.
Elemental analysis. Measures elemental composition, useful as an orthogonal check where it applies.
Mass balance. Not a measurement of its own. It combines the separate determinations so the parts account for the whole.
These methods are not interchangeable, and not every laboratory performs all of them on every product. The USP paper describes characterizing reference standards using multiple complementary techniques, not a testing panel used by every commercial laboratory.
Why the reference standard matters
A quantitative assay compares a sample with a reference standard of known content. An incorrect reference value can therefore bias the measured result. The USP paper describes well-characterized reference standards tested by multiple laboratories, with the assigned content corrected for the purity of the bulk material.
A Real Study Shows Why the Numbers Matter
In November 2024, researchers published a multifactor quality and safety analysis of semaglutide products sold online without a prescription in the Journal of Medical Internet Research. Amir Reza Ashraf, Tim Ken Mackey, Róbert György Vida, and colleagues bought products from online sellers and analyzed them independently.
The sellers’ documentation claimed a purity of at least 99%.
What one vial contained
Take, for example, the vial labeled 3 mg of semaglutide.
| Measurement | Result |
|---|---|
| Total powder in the vial | 50.1 mg |
| Labeled semaglutide | 3 mg |
| Measured semaglutide | 3.86 mg (SD 0.14) |
| Measured content reported by the authors | 7.70% (SD 0.28) |
The vial contained roughly 29% more semaglutide than its label claimed. The researchers reported 28.56%, while a calculation using the rounded figures shown above gives a slightly different result.
Semaglutide was also a small fraction of the powder. Divide the measured peptide by the powder weight and you get the figure the authors report: 3.86 mg divided by 50.1 mg is 0.0770, or 7.70%.
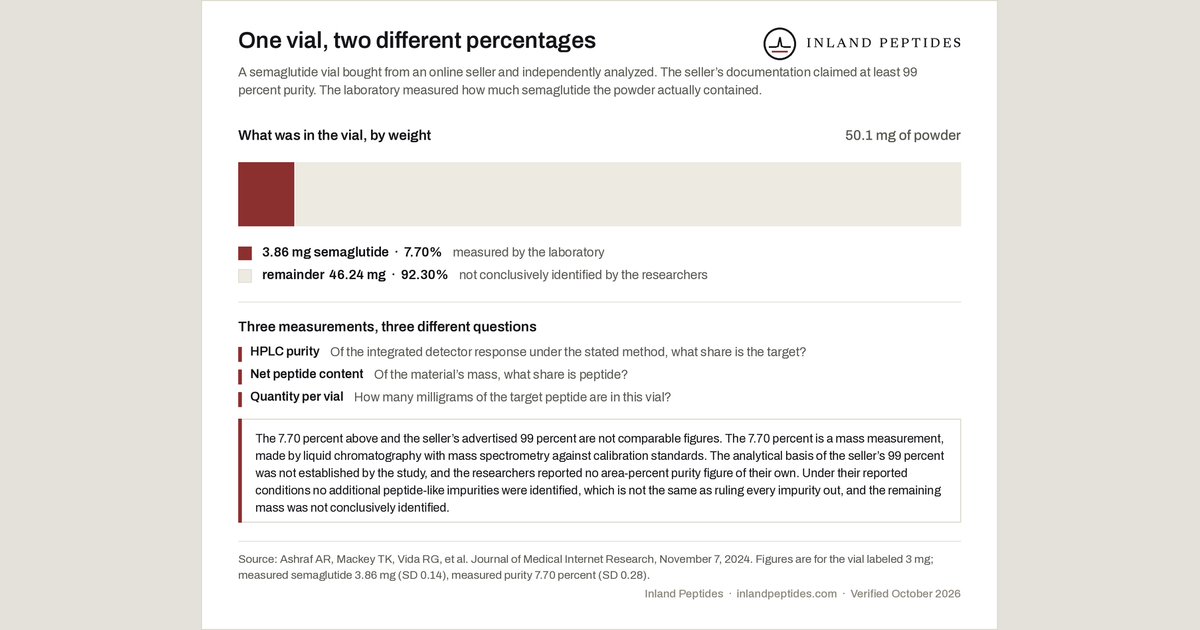
Measured content and advertised purity are not the same number
The study uses the word purity for that 7.70% figure. But it is a mass-based measurement, made by liquid chromatography with mass spectrometry against calibration standards.
It is not a conventional chromatographic area purity. Setting 99% next to 7.70% as though the two percentages were measured the same way would be a mistake. Nor does the study establish what analytical basis the sellers used for their claim.
The researchers also reported a single peptide signal in the chromatogram. Under their reported analytical conditions, the method identified no additional peptide-like impurities. That is not the same as ruling out every possible impurity, because a chromatogram shows what the method is capable of detecting.
The chromatographic analysis identified only the principal peptide signal under the study’s testing conditions. But semaglutide made up just 7.70% of the powder by weight. The authors could not identify the remaining material, although they suggested low-mass, weakly ionizing impurities. They also called for additional testing to identify the constituents.
Does a 10 mg Peptide Vial Actually Contain 10 mg?
“10 mg” is a quantity claim, so it needs a quantity measurement behind it. A purity result does not supply one. Consider a vial where the numbers look like this:
| Measurement | Result |
|---|---|
| Labeled quantity | 10 mg |
| HPLC purity | 99% |
| Independently measured target peptide | 8.5 mg |
These figures are hypothetical, and they show the relationship between the numbers. The two results do not conflict. The purity figure describes relative detector response, while the quantitative assay measures the peptide amount.
So a vial can show 99% chromatographic area purity and still contain only 8.5 mg of the labeled peptide. But those two measurements cannot explain why the quantity falls short.
Do not multiply the purity percentage by the labeled weight. Taking 99% of 10 mg and calling the answer 9.9 mg of peptide treats an area percentage as a mass percentage. They are not the same thing, so the calculation measures nothing.
What Should You Look for on a Peptide COA?
Read each result for what it establishes, and notice what it leaves open.
- Identity. Provides evidence that the tested material is the peptide named, subject to the method’s limitations. Says nothing about how much or how pure.
- HPLC purity. Gives the area percentage and the method behind it. Says nothing about mass per vial.
- Net peptide content. Gives peptide as a share of material mass, on a stated basis. Does not by itself confirm the labeled vial quantity.
- Quantity per vial. Gives milligrams of target peptide. Says nothing about the impurity profile.
- Methods. Tells you which test produced which number. Without it, a percentage is uninterpretable.
- Units and reporting basis. Anhydrous or as-is, free base or salt form. The basis changes the number.
- What is missing. A result that is absent is not a result that passed.
Our guide, How to Verify Peptide Quality and Read a Certificate of Analysis, covers the broader verification process, including how to check the issuing laboratory.
The Bottom Line
Purity, content, and quantity answer three different questions about the same vial.
- HPLC area purity tells you the target peak’s share of the integrated chromatographic detector response.
- Content tells you how much of the powder is peptide.
- Quantity tells you how many milligrams you actually have.
In short, the measurements are not interchangeable. If a COA reports purity but no measured quantity, it has not verified the milligrams stated on the vial. When a certificate reports a percentage, the useful question is always the same: a percentage of what, measured how?