An analysis of 6,441 public peptide laboratory reports found wide variation in purity and the amount of peptide in each vial.
But it did not establish a failure rate for the entire peptide market.
The analysis is a preprint by Christopher L. Mendias and Tariq M. Awan, posted on April 24, 2026. Version 1 remains labeled as not peer reviewed; no journal version was located as of October 28, 2026.
The authors analyzed existing test results rather than testing samples themselves.
Those reports came from Finnrick Analytics, which arranges peptide testing and publishes results.
According to the authors, consumers and vendors submitted samples voluntarily.
What the numbers actually count
The study uses several groups of reports. Each count answers a different question.
| Group | Reports | Purpose |
|---|---|---|
| Reports initially available | 6,487 | Source reports screened across 14 peptides. |
| Excluded for incomplete data | 46 | Excluded because the data were incomplete. |
| Retained dataset | 6,441 | Overall identity and model outcomes, including identity failures. |
| Did not contain the stated peptide | 156 | Included as failures in both models; excluded from purity and amount calculations. |
| Analyzed for purity and amount | 6,285 | Purity and measured-amount results, including medians. |
| Had an endotoxin result | 243 | A separately analyzed subset of the source reports. |
The authors started with 6,487 reports and excluded 46 with incomplete data, leaving 6,441.
The overall identity and model failure rates use that retained group, including reports in which the stated peptide was not found.
By contrast, the purity and measured-amount results come from 6,285 reports, excluding the 156 identity failures.
Endotoxin results were available for 243 reports and analyzed separately. The paper’s workflow shows this group branching from the original source dataset.
Where did the reports come from?
They came from a public database of test results published by Finnrick Analytics.
The reports were not established as a probability sample of the wider market.
In probability sampling, a defined selection process gives each item a known chance of being chosen.
The authors identify voluntary submissions as a source of selection bias.
Yet the study does not establish whether that bias raises or lowers the observed failure rates, or by how much.
The paper describes consumers and peptide synthesis companies submitting samples for testing. Finnrick’s current methodology page instead describes the company sourcing samples from vendors and sending them to third-party laboratories.
These descriptions can coexist, because today’s methodology does not necessarily describe how every sample in the historical dataset was obtained.
The sourcing mix behind those reports remains unclear.
The paper also does not establish that each report represents a separate batch, vial, or purchase.
Although the dataset included batch identifiers and container descriptions, the study’s totals count reports.
The 6,441 reports should therefore not be read as 6,441 independent purchases from different production runs.
The reports span December 17, 2024, through April 3, 2026, and represent 203 peptide synthesis companies.
Representation, however, was uneven. The 20 most-represented vendors accounted for 3,098 samples, or 49.3% of the 6,285-report purity-and-amount group.
Purity and amount are two different measurements
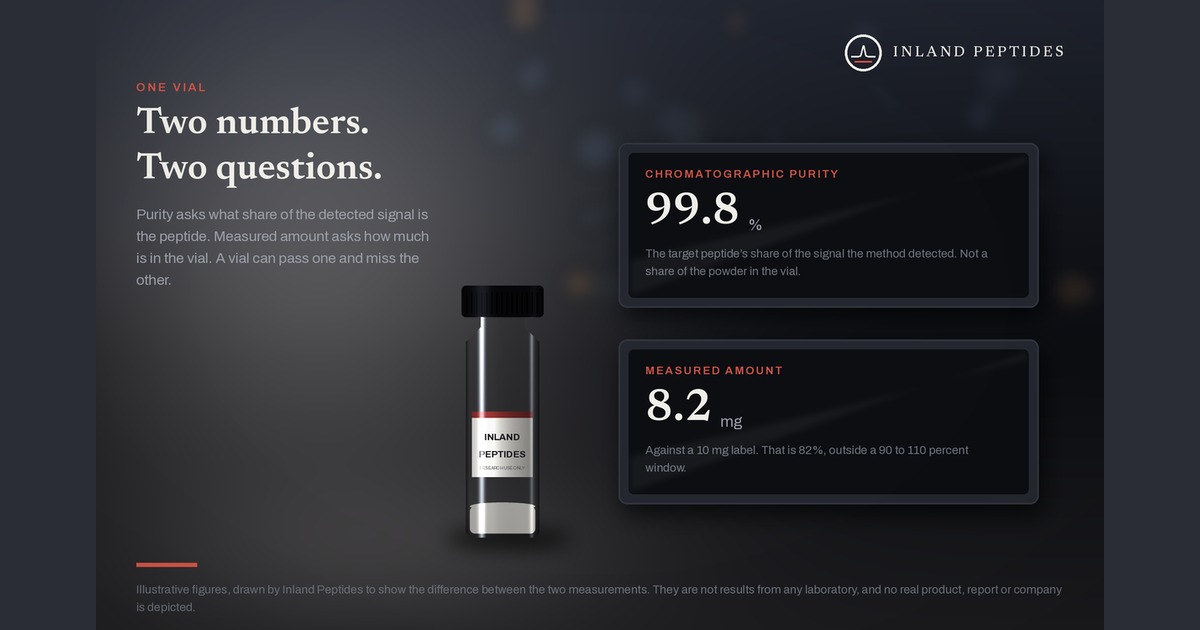
Chromatographic purity describes the target peptide’s share of the signal detected by the method.
But it does not establish what percentage of the vial’s powder weight is peptide.
Substances the method does not detect are not included in that calculation.
Measured quantity, on the other hand, tells you how much peptide is present.
The paper expresses this as a percentage of the labeled amount and calls it “measured abundance.”
So a vial can do well on one and badly on the other.
Consider this hypothetical example:
A vial is labeled 10 mg.
The laboratory reports chromatographic purity of 99.8%.
A separate quantity measurement finds 8.2 mg of peptide in the vial.
The purity passes either of the study’s thresholds. But the quantity is only 82% of the label, below both models’ acceptance windows.
The example shows an amount shortfall despite high chromatographic purity. Neither number establishes the absence of contaminants that were not separately tested.
Passing purity while falling outside the amount window was the study’s largest failure category. The two measurements therefore need to be checked separately.
What were the two assessment models?
The authors used a compounding-oriented model and a stricter manufacturing-oriented model, each with its own quantity and purity thresholds.
- Compounding-oriented model: 90, 110% of the labeled amount and at least 98.0% purity.
- Manufacturing-oriented model: 95, 105% of the labeled amount and at least 99.5% purity.
The reported failure rates were 41.6% under the first model and 71.1% under the second.
Both rates use the retained group of 6,441 reports and include identity failures.
The authors chose these benchmarks using pharmaceutical guidance and literature. They describe the 98.0% purity threshold as a practical benchmark rather than a universal regulatory requirement.
These study thresholds are not universal legal specifications or FDA determinations about individual products.
Neither model was a complete pharmaceutical release assessment.
Passing does not establish sterility, acceptable heavy-metal or residual-solvent levels, control of particulates, or stability.
The analysis included identity testing, but it did not establish full sequence or structural characterization.
Identity, purity, measured amount, and endotoxin findings
Identity
The stated peptide was not found in 156 of the 6,441 reports, or 2.4%.
The reported identity failures were retatrutide, 59; tirzepatide, 30; CJC-1295, 22; BPC-157, 17; tesamorelin, 11; semaglutide and ipamorelin, six each; TB-500, four; and GHK-Cu, one.
These are counts rather than within-compound failure rates. Exact per-compound denominators were not verified from the materials available for this review.
The paper does not identify what those samples contained instead. Nor does failure to find the labeled peptide establish that a vial was empty.
Purity
Across the 6,285 reports analyzed for purity and amount, median purity was 99.80%. The interquartile range was 99.50, 99.90%.
The interquartile range contains the middle 50% of results, not the full range.
Most samples, in other words, had high purity by this measure.
The paper’s figures cover all 14 compounds, while its results text gives selected exact medians:
GHK-Cu, 99.90%; CJC-1295, 98.49%; and TB-500, 97.29%.
Measured amount
Median measured quantity was 101.80% of the label, with an interquartile range of 95.00, 109.00%.
The midpoint was slightly above the labeled amount, while the middle half of results extended both below and above it.
The paper does not give separate counts for samples below and above either model’s amount window.
Selected medians in the results text include sermorelin at 97.45% of the label and BPC-157 at 103.50%.
How the failures break down
Missing the amount window was more common than missing the purity threshold.
The percentages below use all 6,441 retained reports. Identity failures form a separate 2.4% category.
Under the compounding-oriented model, 32.8% passed purity but missed the amount window, 3.0% passed amount but missed purity, and 3.3% missed both.
Under the stricter model, 44.3% passed purity but missed amount, 8.4% passed amount but missed purity, and 15.9% missed both.
The text also reports selected percentages meeting both criteria:
Compounding-oriented model: retatrutide, 67.8%; thymosin beta-4, 64.5%; survodutide, 64.0%; and TB-500, 22.5%.
Stricter model: retatrutide, 47.0%; ipamorelin, 34.2%; PT-141, 29.7%; tirzepatide, 13.8%; CJC-1295, 10.7%; and TB-500, 7.5%.
These selected figures are not a complete ranking of the 14 compounds.
The endotoxin subset
The 243 reports with endotoxin results were analyzed separately from the two quality models.
They represent less than 4% of the original source reports. The often-quoted 15% finding applies to this subset:
- No detectable endotoxin: 74 reports, approximately 30%.
- Endotoxin below the quantification threshold: 133 reports, approximately 55%.
- Quantifiable endotoxin: 36 reports, or 14.8%, rounded to 15% in the paper.
The paper reports the category thresholds in inconsistent units: endotoxin units per milliliter in the results text and units per vial in the figure caption.
Those units cannot be substituted for one another, so the numerical ranges are not reproduced here.
The 15% describes quantifiable endotoxin rather than the percentage exceeding an applicable safety limit.
The paper did not apply an endotoxin pass/fail threshold. An applicable limit depends on factors such as route of administration and dose, which the dataset does not establish.
The authors found no association between purity and endotoxin in the 36 reports with quantifiable endotoxin.
That limited analysis, though, does not establish predictive performance across all 243 reports.

What the study cannot establish
The study’s findings have several limits:
- A market-wide failure rate. The submitted samples were not established as representative of the wider market.
- The quality of a particular purchase. Historical results from selected samples do not establish the contents of another vial or batch.
- Current quality. The latest reports included were dated April 3, 2026.
- Safety. Purity, measured quantity, and the limited endotoxin results do not provide a complete safety assessment. The analysis did not establish sterility, heavy-metal or residual-solvent levels, particulate control, stability, or full structural characterization.
- That every failure means contamination. Under both models, the largest failure category passed purity but missed the amount window.
The authors describe their failure rates as a lower bound on the supply chain’s quality problems.
Within the tested group, additional valid quality requirements could identify failures among samples that passed the existing criteria.
Even so, that does not establish a numerical lower bound for the whole market. The samples were not representative, and the direction of selection bias is still unknown.
What to check on a single report
For a particular purchase, check the report itself instead:
- Identity. Does the report identify the peptide named on the label using an appropriate method?
- Measured amount. Does it give the quantity of peptide per vial, and how does that compare with the label?
- Purity. Does it state the purity result, method, and detection conditions?
- Other tests. Endotoxin, sterility, heavy metals, and residual solvents require separate tests. If results are absent, the report does not establish whether those attributes were tested or met a requirement.
- Batch identification. Does the report’s batch or lot number match the vial?
- Verification. Will the issuing laboratory confirm the report when contacted through independently verified details?